STATS
From jmips
Project metrics summaryProject analysis by [cccc] Feb 29 2012
The following explanatory rubric is largely reproduced as-is from the cccc output:
CommentaryThe measures overall are very good, showing a high comment to code ratio (2 comments for every 3 lines of code) and a small number of lines (68) per class, which is short enough to fit nearly all of a class on a standard page (53 lines) so certainly individual methods will fit on a page, on average. Bearing in mind that there are certainly some very long classes and methods, however, these averages are intrinsically misleading because of the variance. There must also be some very short methods and classes! The average displayed here weights a class by its number of lines, so one class of 100 lines and four classes of 5 lines each would work out to an average of 24 lines per class, which doesn't really capture the idea of "most classes are very short, and one is way too long". The complexity measures the number of alternate paths through a program. In general every different path deserves a comment, so the measure says that every path gets three lines of due comment. That is very reasonable, but it is clear from that alone if the comments are in the right place. The comments might be all block-header, for example, with nothing commenting sites of difficulty in situ. The information flow measures are unusually high, reflecting poor separations. That is to be expected, since the model models a real physical situation in which everything is connected! COCOMO estimateThe COCOMO estimate is as follows based on 3.7KLOC, complexity C=3.6, S=1.2 for systems programming code (high complexity), and a factor M consisting of a robustness factor of 1.5 (high reliability) times a factor of 1.0 for an "adequate development environment" and a team rating of 4 (experienced engineer!) resulting in an advantage factor of 0.33 (small project), giving M = 1.5 * 1.0 * 0.33 = 0.5 and producing an effort estimate SEM = C * KLOC^S * M = 3.6 * 3.7^1.2 * 0.5 = 8.65 Thus the project is estimated by COCOMO at having required 8.65 months of software engineering effort. At say, a seat-cost of 50000 GBP/annum, that is a worth of 36000 GBP. However, the estimate is highly sensitive to factors such as the working tools .. If one were to suppose that the development environment were in fact excellent, not adequate, then M would be halved (replace "1.0" by "0.5") and the cost estimate would be halved: SEM = 4.325 So the author should have asked for 18000 pounds to break even. Assuming a profit margin of 50% (or deadline bonus ..) the asking price should have been 27000 pounds. In fact, the first code entry (Debug.java!) for jMIPS 1.0 appears to have been February 24 2010, and there are entries going up to May 29 2010 (CPU5.java) for it. That is three months. At that time the project consisted of 5218 LOC and 3443 lines of comments. So the code has reduced since (by dint of hard work! Duplications have been removed). It would have been completed 1.3 months ahead of time if the COCOMO estimate had been used in the bidding. The "seat costs" are the costs of keeping authors alive (paying salary) plus running overheads, which include things like office rent and power. 50000 pounds per annum is on the low side for that nowadays. We may repeat the calculation taking into account the older figures for lines of code, supposing that at that time the code was of lesser quality, with a robustness factor of "1.0" instead of "1.5", and that gives for 5.2KLOC: M = 1.0 * 0.5 * 0.33 = 0.166 and SEM = C * KLOC^S * M = 3.6 * 5.2^1.2 * 0.166 = 4.32 By May 16 2010, all the project documentation (simulator[1-5].html, README, etc) had also been written. It looks to have been as complete as it should have been. So the estimate is the same whichever way one cuts it. It should have taken something more than four months to develop, and it was developed in three. If it had been costed according to COCOMO, a profit would have been made.
Measures per classThis is the analysis per class. The analysis software incorrectly included certain system classes (PrintStream, Exception, RandomAccessFile, etc) which have been left out here but which may have skewed the analysis figures overall. It is also clear that there are other miscounts. "Read" is measured at zero lines! But then there are multiple interior classes named "Read", one in each "Pipe", of which there are also multiples, one for each CPU. The analysis software has become confused. I have removed the "zero lines" classes from the table, for clarity. Certain classes which had no real existence (e.g.: "Shdr[]") were also included by the analysis, and I have removed those from the table. You may wish to redo the analysis one model at a time.
The analysis marks the Debug class as too long and too complex! That is not an issue - it does not affect the functioning of the software. The complexity is in its printout routines. On the other hand, one of the few bugs reported traces back to incorrect Debug class use, so perhaps the analysis is correct! Delta source analysisThe following graph shows numbers of lines changed in the experimental (v1.8) branch over a one-month period.
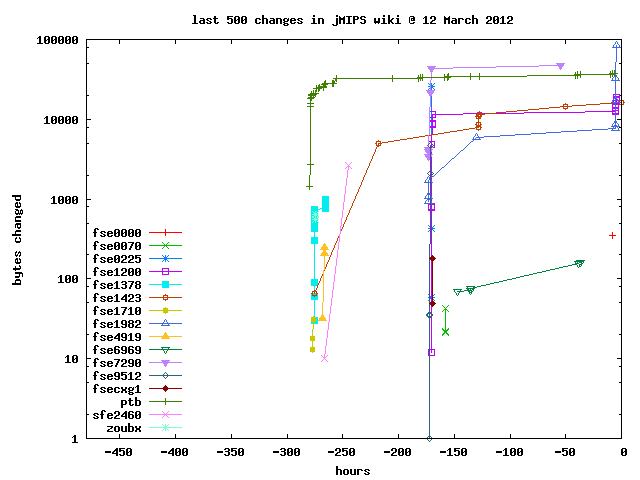
Contributor "ptb" has about 5000 lines of changes in 600 hours, or about 8.4 lines changed per hour, which works out as 200 lines of changes every day. These are mostly not new lines, however, but fixes for old lines. Contributor "fse6969" makes about 1 line change per hour, or 24 lines changed per day. This is about the expected level for continuous (perfective) maintenance activity. Contributions from other contributors have been sporadic in the period. A new file contribution from "fse0724" is good development activity, but not followed up with maintenance engineering beyond an initial first adjustment. A similar graph for contributions to the project wiki is shown below:
|